Timing update #2
In my original post about time tracking I said I'd give it a shot and report back after a week. I then said I'd follow up after a month, and here we are. I tracked roughly 1000 hours. What did I find out?
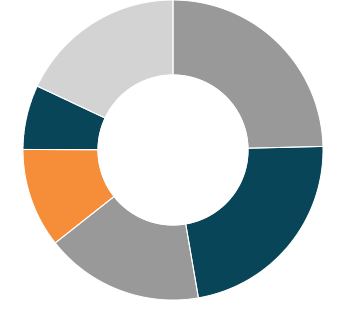
Not a lot that wasn't suggested by the weekly data, which is at least indicative that the weekly data was pretty accurate. The biggest chunk, the grey in the top right, is untracked time, so actual tracked time was only 820 hours. Of that, the top was sleep in dark blue with 240 hours (29%), misc in grey with 180 hours (20%), friends in orange with 113 hours (14%) and this website in dark blue with 73 hours (9%).
I'm surprised that friends was as high as it was. 14% is roughly 3.5 hours per day, but I guess I'm more social than I realised. I evidently didn't make that much of a dent in miscellaneous time, because it still took about 4-5 hours per day. One thing that's nice is that prototypes and fun were both up on the list from last time (4% and 5% respectively). I also saw a big chunk of time drop into Markov Technology, which is both accurate and gratifying.
I feel like to get things beyond this point, I'll have to do more than just look at the data. I'll need to monitor it as it changes over time, make theories and predictions, and observe the results. Probably, that's going to mean integrating it in some way with MeDB to do actual analytics with. On a related note, Toggl, which I was using, has a showstoppingly broken concurrency model, so I might need to migrate away to another tool if I want to use it on multiple devices.
Regardless, my overall conclusion is that this is useful data. I don't have terribly useful results yet, but at least one surprise insight (friend time) and at least one meaningful metric (misc time) to work on. Overall I'd call it a success, especially given that the overhead is fairly minimal once you get used to it.